Market Outlook
November 15, 2017
Market Cues
Domestic Indices
Chg (%)
(Pts)
(Close)
Indian markets are likely to open Negative tracking global indices and SGX Nifty.
BSE Sensex
(0.3)
(92)
32,942
U.S. stock benchmarks finished lower, but off their intraday lows, on Tuesday, with
Nifty
(0.4)
(38)
10,187
Wall Street slumping in the face of uncertainty around efforts to overhaul tax policy
Mid Cap
(0.2)
(36)
16,495
and a downturn in crude-oil futures. The Dow Jones DJIA declined 0.1% to close at
Small Cap
(0.2)
(31)
17,540
23,409 and The S&P 500 fell 0.2% to finish at 2,579. Meanwhile, the NASDAQ
dipped 0.3% to end at 6,738.
Bankex
(0.3)
(75)
28,706
U.K.’s benchmark stock index closed with a tiny loss, with miners weighing the most
Global Indices
Chg (%)
(Pts)
(Close)
after Chinese data suggested economic growth in the world’s second-largest
economy is slowing down. The FTSE 100 index UKX, fell 0.01%, to end at 7,414.
Dow Jones
(0.1)
(30)
23,409
Nasdaq
(0.3)
(20)
6,738
On domestic front, shares fell modestly on Tuesday as rising crude prices as well as
FTSE
(0.0)
(1)
7,414
domestic data revealing upward pressure on both consumer and wholesale inflation
helped spur worries over likely fiscal slippages. India's consumer inflation quickened
Nikkei
(0.9)
(209)
22,171
to 3.58% in October, the fastest pace in seven months. This might add pressure on
Hang Seng
(0.7)
(194)
28,958
the RBI to keep rates unchanged in the upcoming policy meeting in December. The
Shanghai Com
(0.8)
(27)
3,403
benchmark BSE Sensex ended the session down 0.28 % at 32,942. The broader
Nifty index fell by 0.38 % to finish at 10,187.
Advances / Declines
BSE
NSE
News Analysis
Advances
1,146
702
Result Review: Sun Pharmaceuticals
Declines
1,568
1,035
Unchanged
149
67
Detailed analysis on Pg2
Investor’s Ready Reckoner
Volumes (` Cr)
Key Domestic & Global Indicators
BSE
4,128
Stock Watch: Latest investment recommendations on 150+ stocks
NSE
33,861
Refer Pg5 onwards
Net Inflows (` Cr)
Net
Mtd
Ytd
Top Picks
CMP
Target
Upside
FII
(136)
9,602
48,054
Company
Sector
Rating
(`)
(`)
(%)
MFs
2,326
3,825
99,236
Blue Star
Capital Goods
Buy
702
867
23.5
Dewan Housing Finance
Financials
Accumulate
622
712
14.5
Asian Granito
Other
Buy
491
570
16.1
Top Gainers
Price (`)
Chg (%)
Navkar Corporation
Other
Buy
188
265
40.7
Repcohome
632
6.9
KEI Industries
Capital Goods Accumulate
332
380
14.6
Vakrangee
650
5.4
More Top Picks on Pg4
Tataglobal
247
5.2
Key Upcoming Events
Gnfc
448
5.1
Previous
Consensus
Date
Region
Event Description
Videoind
14
4.8
Reading
Expectations
Nov15
UK
Jobless claims change
1.70
Nov15
US
Consumer price index (mom)
0.50
0.10
Top Losers
Price (`)
Chg (%)
Nov16
US
Initial Jobless claims
239.00
235.00
Ncc
96
(7.7)
Nov16
Euro Zone Euro-Zone CPI (YoY)
1.40
1.40
Jpassociat
20
(7.3)
Nov16
US
Industrial Production
0.28
0.50
Religare
42
(5.7)
More Events on Pg7
Finolexind
660
(5.2)
Mmtc
79
(5.0)
As on November, 14 2017
Market Outlook
November 15, 2017
News Analysis
Sun Pharmaceuticals (CMP: `527 / TP: `558 /Upside: 6%)
In rupee terms, revenues came in at `6,590cr V/s `7,764cr in 2QFY2017, down
15.1% yoy, mainly driven by the dip in the USA business. On the operating front
the EBITDA margin, came in at 21.8% V/s 34.3% in 2QFY2017; a yoy dip of
12.5%, mainly due to pricing pressure. Consequently, PAT come in at `1,002cr
V/s `752cr expected, a de-growth of 55.2% yoy. We maintain our accumulate
rating on the stock.
Y/E
Sales OPM
PAT
EPS ROE P/E P/BV EV/EBITDA EV/Sales
March
(` cr)
(%)
(` cr)
(`)
(%)
(x)
(x)
(x)
(x)
FY2018E
28,466
20.8
5,101
21.3
13.0
24.7
3.1
19.6
4.1
FY2019E
31,826
22.4
5,949
24.8
15.2
21.2
2.8
15.8
3.5
IPO Update - Khadim Ltd & New India Assurance Ltd
We have recommended NEUTRAL rating to recent IPO Khadim India Ltd and The
New India Assurance Company Ltd (NIA). At yesterday closing price Khadim is
down 8.22% from IPO price and NIA id down 12.5% from IPO price.
Economic and Political News
Govt seeks special dividend from RBI for bank recapitalisation
Exports fall 1.2% to $23 billion in Oct
300% rise in PAN applications post demonetization: CBDT
Corporate News
Laurus Labs gets EIR from USFDA for AP plant.
Ujjivan Financial Services says reports of acquisition by another bank are
incorrect.
IndiGo challenges Delhi airport directive to shift operations to Terminal 2
Market Outlook
November 15, 2017
Top Picks ★★★★★
Market Cap
CMP
Target
Upside
Company
Rationale
(` Cr)
(`)
(`)
(%)
Strong growth in domestic business due to its leade`hip
in acute therapeutic segment. Alkem expects to launch
Alkem Laboratories
23,864
1,996
2,125
6.5
more products in USA, which bodes for its international
business.
We expect the company would report strong profitability
Asian Granito
1,478
491
570
16.1
owing to better product mix, higher B2C sales and
amalgamation synergy.
Favorable outlook for the AC industry to augur well for
Cooling products business which is out pacing the
Blue Star
6,729
702
867
23.5
market growth. EMPPAC division's profitability to
improve once operating environment turns around.
With a focus on the low and medium income (LMI)
consumer segment, the company has increased its
Dewan Housing Finance
19,502
622
712
14.5
presence in tier-II & III cities where the growth
opportunity is immense.
Loan growth is likely to pick up after a sluggish FY17.
Lower credit cost will help in strong bottom-line growth.
Karur Vysya Bank
7,536
125
180
44.3
Increasing share of CASA will help in NIM
improvement.
High order book execution in EPC segment, rising B2C
KEI Industries
2,599
332
380
14.6
sales and higher exports to boost the revenues and
profitability
Expected to benefit from the lower capex requirement
Music Broadcast
2,151
377
434
15.1
and 15 year long radio broadcast licensing.
Massive capacity expansion along with rail advantage
Navkar Corporation
2,834
188
265
40.7
at ICD as well CFS augur well for the company
Strong brands and distribution network would boost
Siyaram Silk Mills
2,719
580
650
12.0
growth going ahead. Stock currently trades at an
inexpensive valuation.
Market leadership in Hindi news genre and no.
2
viewership ranking in English news genre, exit from the
TV Today Network
2,180
365
435
19.0
radio business, and anticipated growth in ad spends by
corporate to benefit the stock.
After GST, the company is expected to see higher
volumes along with improving product mix. The Gujarat
Maruti Suzuki
245,531
8,128
8,890
9.4
plant will also enable higher operating leverage which
will be margin accretive.
We expect loan book to grow at 24.3% over next two
GIC Housing
2,326
432
655
51.7
year; change in borrowing mix will help in NIM
improvement..
Source: Company, Angel Research
Market Outlook
November 15, 2017
Key Upcoming Events
Global economic events release calendar
Bl oomberg Data
D ate
Time
C ountry
Event Description
Unit
Period
L ast Reporte d
E stimate d
Nov 15, 2017
3:00 PM UK
Joble ss claims change
% Change
Oct
1.70
7:00 PM US
Consumer price index (mom)
% Change
Oct
0.50
0.10
Nov 16, 2017
7:00 PM US
Initial Jobless claims
Thousands
Nov 11
239.00
235.00
3:30 PM Euro Zone
Euro-Zone CPI (YoY)
%
Oct F
1.40
1.40
7:45 PM US
Industrial Production
%
Oct
0.28
0.50
Nov 17, 2017
7:00 PM US
Housi ng Starts
Thousands
Oct
1,127.00
1,190.00
7:00 PM US
Building permits
Thousands
Oct
1,225.00
1,250.00
Nov 21, 2017
8:30 PM US
Existing home sales
Million
Oct
5.39
5.41
Nov 22, 2017
8:30 PM Euro Zone
Euro-Zone Consumer Confidence
Value
Nov A
(1.00)
Nov 23, 2017
2:00 PM Germany
PMI Manufacturing
Value
Nov P
60.60
2:00 PM Germany
PMI Services
Value
Nov P
54.70
Nov 27, 2017
8:30 PM US
New home sales
Thousands
Oct
667.00
615.00
Nov 28, 2017
8:30 PM US
Consumer Confidence
S.A./ 1985=100
Nov
125.90
123.00
3:00 PM UK
GDP (YoY)
% Change
3Q P
1.50
Nov 29, 2017
7:00 PM US
GDP Qoq (Annualise d)
% Change
3Q S
3.00
3.40
Nov 30, 2017
2:25 PM Germany
Unempl oyment change (000's)
Thousands
Nov
(11.00)
6:30 AM China
PMI Manufacturing
Value
Nov
51.60
Dec 01, 2017
3:00 PM UK
PMI Manufacturing
Value
Nov
56.30
Dec 06, 2017
2:30 PM India
RBI Reverse Re po rate
%
Dec 6
5.75
2:30 PM India
RBI Cash Reserve ratio
%
Dec 6
4.00
3:00 PM UK
Industrial Production (YoY)
% Change
Oct
2.50
Dec 08, 2017
China
Exports YoY%
% Change
Nov
6.90
2:30 PM India
RBI Repo rate
%
Dec 6
6.00
7:00 PM US
Change in N onfarm payrolls
Thousands
Nov
261.00
Source: Bloomberg, Angel Research
Market Outlook
November 15, 2017
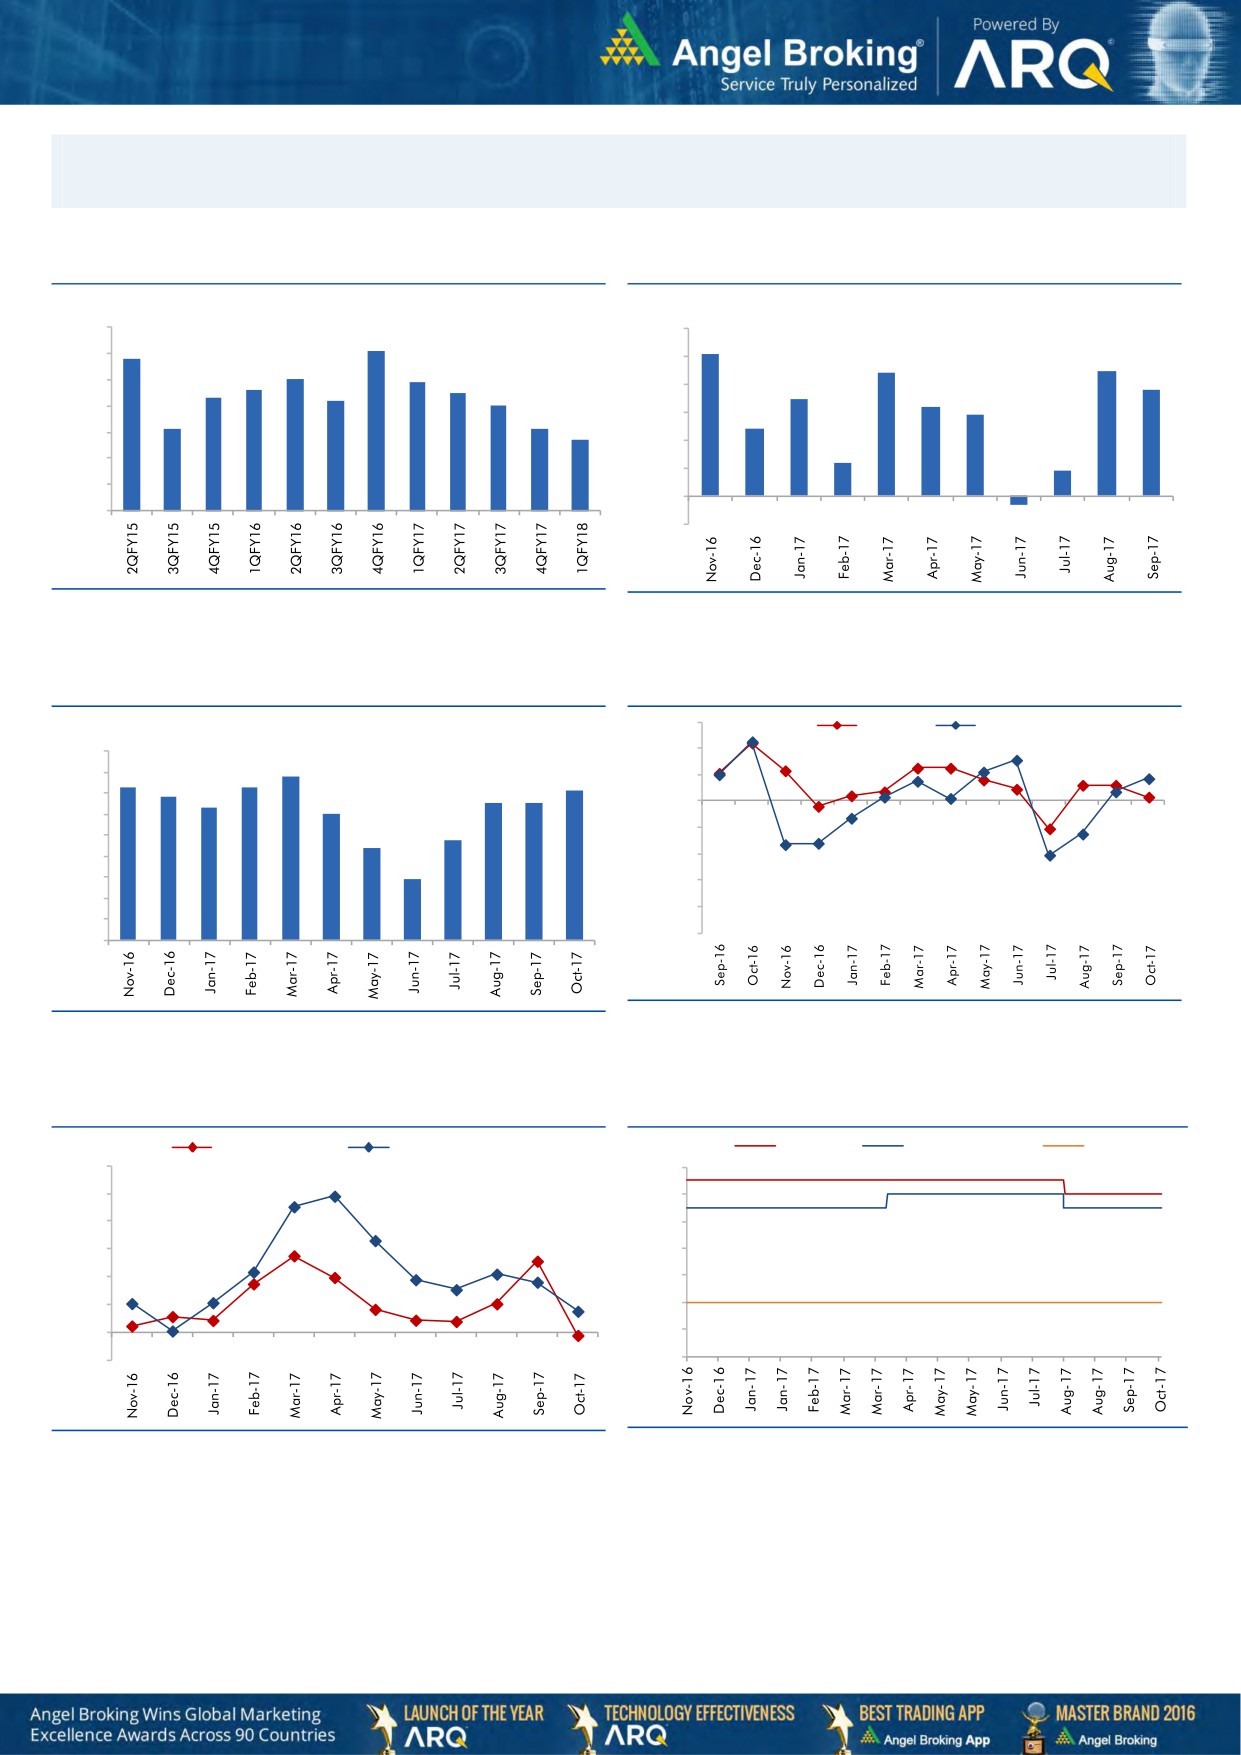
Macro watch
Exhibit 1: Quarterly GDP trends
Exhibit 2: IIP trends
(%)
(%)
10.0
6.0
9.1
5.1
8.8
9.0
5.0
4.4
4.5
8.0
7.9
7.6
7.5
3.8
8.0
7.3
7.2
4.0
3.5
7.0
3.2
2.9
7.0
6.1
6.1
3.0
2.4
5.7
6.0
2.0
1.2
5.0
0.9
1.0
4.0
-
3.0
(1.0)
(0.3)
Source: CSO, Angel Research
Source: MOSPI, Angel Research
Exhibit 3: Monthly CPI inflation trends
Exhibit 4: Manufacturing and services PMI
56.0
Mfg. PMI
Services PMI
(%)
4.5
54.0
3.9
4.0
3.6
3.7
3.6
52.0
3.4
3.2
3.3
3.3
3.5
3.0
50.0
3.0
2.4
48.0
2.5
2.2
2.0
46.0
1.5
1.5
44.0
1.0
42.0
0.5
40.0
-
Source: Market, Angel Research; Note: Level above 50 indicates expansion
Source: MOSPI, Angel Research
Exhibit 5: Exports and imports growth trends
Exhibit 6: Key policy rates
(%)
Exports yoy growth
Imports yoy growth
(%)
Repo rate
Reverse Repo rate
CRR
60.0
6.50
50.0
6.00
40.0
5.50
30.0
5.00
20.0
4.50
10.0
4.00
0.0
3.50
(10.0)
3.00
Source: Bloomberg, Angel Research
Source: RBI, Angel Research
Market Outlook
November 15, 2017
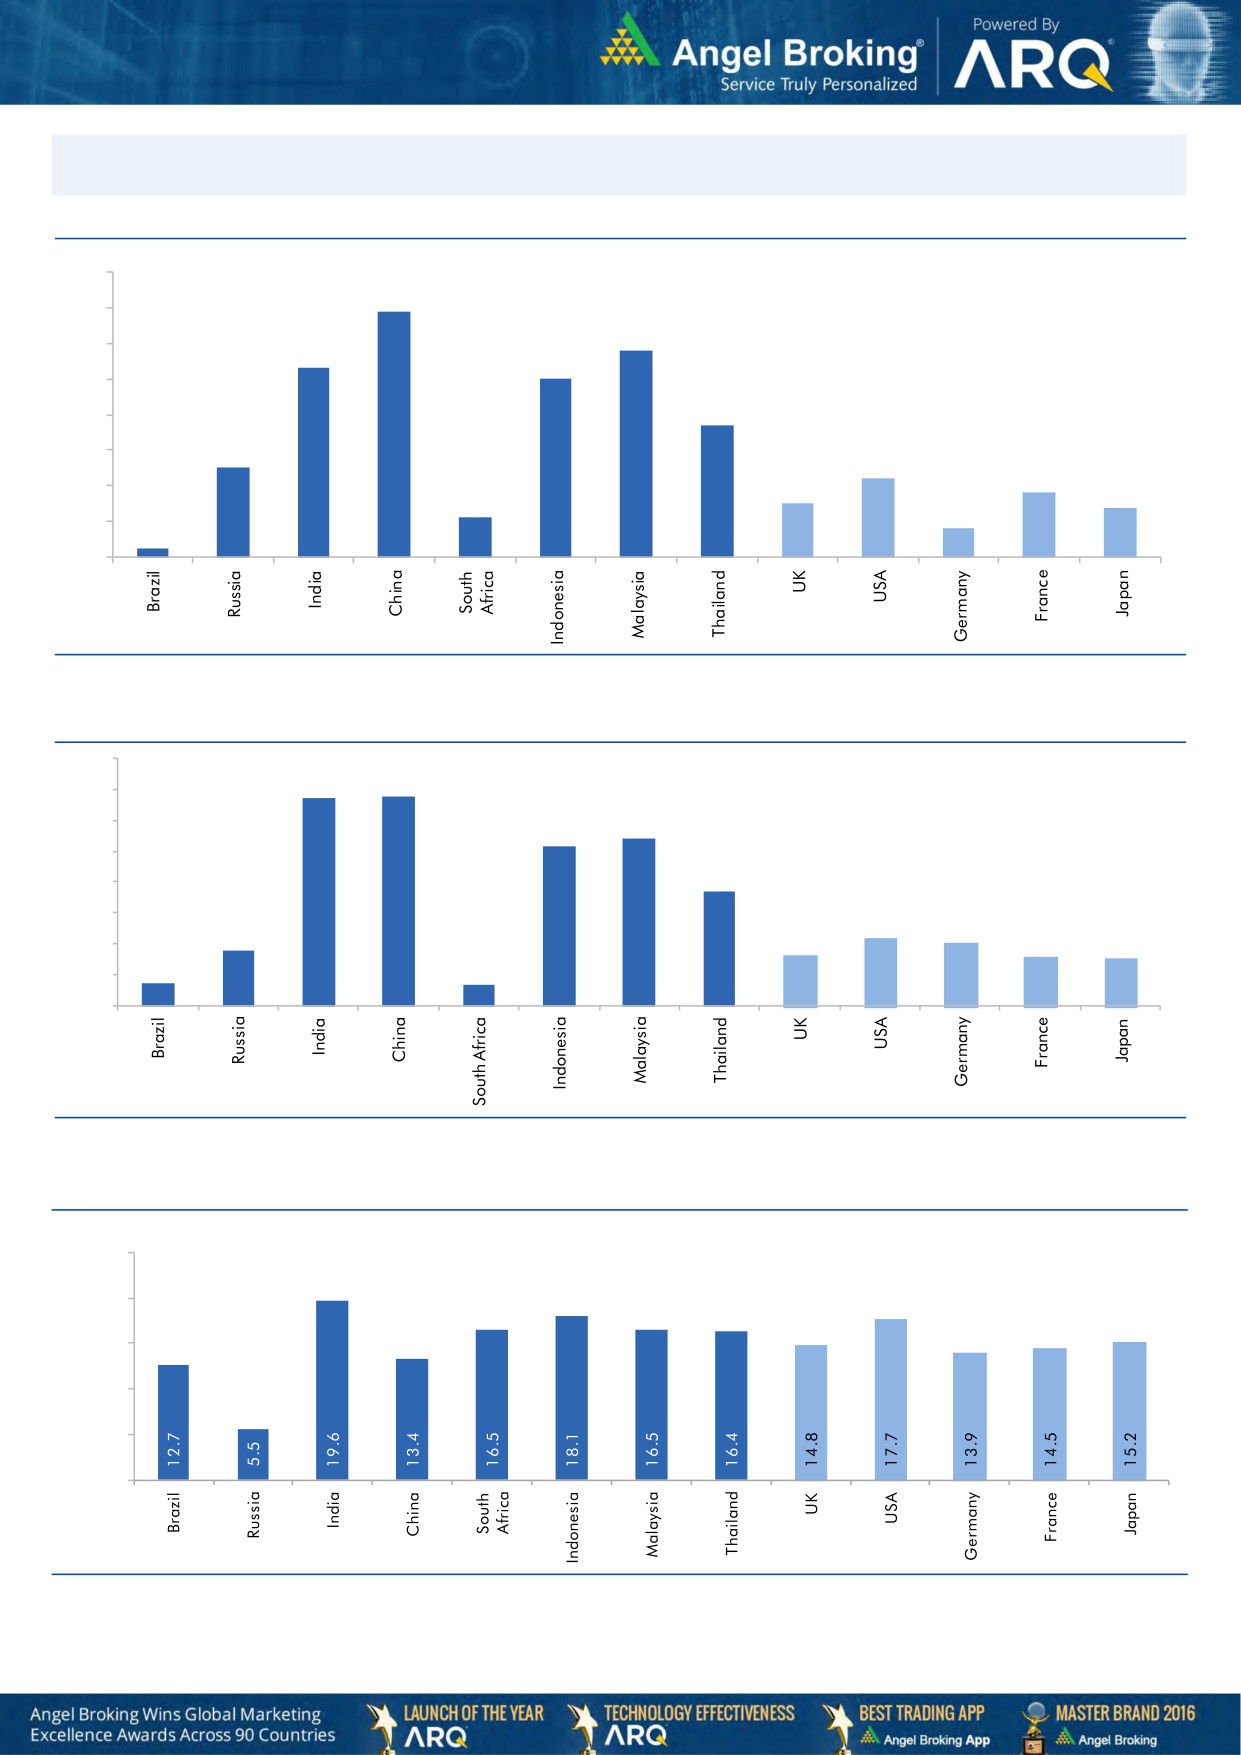
Global watch
Exhibit 1: Latest quarterly GDP Growth (%, yoy) across select developing and developed countries
(%)
8.0
6.9
7.0
5.8
6.0
5.3
5.0
5.0
1.1
3.7
4.0
2.5
3.0
2.2
1.8
2.0
1.5
1.4
0.8
1.0
0.3
-
Source: Bloomberg, Angel Research
Exhibit 2: 2017 GDP Growth projection by IMF (%, yoy) across select developing and developed countries
(%)
6.7
6.8
7.0
6.0
5.4
5.2
5.0
3.7
4.0
3.0
1.8
2.2
2.0
1.7
1.6
2.0
0.7
1.5
0.7
1.0
-
Source: IMF, Angel Research
Exhibit 3: One year forward P-E ratio across select developing and developed countries
(x)
25.0
20.0
15.0
10.0
5.0
-
Source: IMF, Angel Research
Market Outlook
November 15, 2017
Exhibit 4: Relative performance of indices across globe
Returns (%)
C ountry
Name of index
Closing price
1M
3M
1YR
Brazil
Bovespa
70,827
(7.6)
5.1
15.7
Russia
Micex
2,167
3.4
11.1
6.8
India
Nifty
10,187
0.9
3.7
19.5
China
Shanghai Composite
3,430
0.7
4.3
8.6
South Africa
Top 40
53,274
3.5
9.5
18.3
Mexico
Mexbol
47,874
(4.2)
(6.8)
6.6
Indonesia
LQ45
993
0.5
3.5
7.5
Malaysia
KLCI
1,734
(1.2)
(2.5)
5.2
Thailand
SET 50
1,084
(0.8)
8.3
17.0
USA
Dow Jones
23,409
2.4
6.4
23.7
UK
FTSE
7,414
(1.6)
0.4
9.8
Japan
Nikkei
22,380
6.8
13.4
30.3
Germany
DAX
13,033
0.4
7.1
22.0
France
CAC
5,316
(0.7)
2.7
16.9
Source: Bloomberg, Angel Research p68in4
Stock Watch
November 15, 2017
Company Name
Reco
CMP
Target
Mkt Cap
Sales ( Čcr )
OPM(%)
EPS (Č)
PER(x)
P/BV(x)
RoE(%)
EV/Sales(x)
(Č)
Price ( Č)
( Č cr )
FY18E FY19E
FY18E
FY19E
FY18E
FY19E
FY18E
FY19E
FY18E
FY19E
FY18E
FY19E
FY18E
FY19E
Agri / Agri Chemical
Rallis
Reduce
227
209
4,423
1,873
2,099
15.0
15.0
9.5
10.5
23.9
21.7
3.6
3.3
15.8
16.0
2.3
2.0
United Phosphorus
Accumulate
743
820
37,784
18,922
21,949
18.0
18.5
36.2
45.6
20.5
16.3
4.3
3.6
22.7
23.8
2.2
1.8
Auto & Auto Ancillary
Ashok Leyland
Accumulate
114
127
33,369
23,339
27,240
10.1
10.8
4.7
6.2
24.5
18.3
4.9
4.3
20.0
23.6
1.4
1.2
Bajaj Auto
Neutral
3,266
-
94,519
23,936
27,955
19.5
20.1
142.7
167.3
22.9
19.5
5.0
4.5
21.8
22.8
3.5
3.0
Bharat Forge
Buy
692
875
32,226
7,637
8,755
21.7
23.2
36.1
47.3
19.2
14.7
3.4
2.9
18.5
20.8
4.1
3.5
Eicher Motors
Neutral
30,090
-
81,911
19,043
22,837
19.5
19.9
835.4
1,019.0
36.0
29.5
13.5
10.4
40.9
37.8
4.2
3.4
Gabriel India
Neutral
197
-
2,823
1,782
2,033
9.7
10.2
7.1
8.9
27.7
22.2
5.6
4.7
21.0
22.2
1.5
1.3
Hero Motocorp
Accumulate
3,654
4,129
72,962
32,239
36,878
16.0
15.6
184.4
206.5
19.8
17.7
6.2
5.5
31.3
30.7
2.0
1.8
Jamna Auto Industries Neutral
63
-
2,508
1,441
1,662
14.4
14.8
13.9
17.6
4.5
3.6
1.2
1.0
30.0
31.0
1.7
1.5
Mahindra and Mahindra Neutral
1,430
-
88,810
46,971
53,816
13.6
14.0
67.7
79.8
21.1
17.9
3.0
2.7
15.0
15.9
1.8
1.5
Maruti
Accumulate
8,128
8,890
245,531
80,985
97,917
15.6
16.9
282.3
370.4
28.8
21.9
6.3
5.1
21.8
23.1
2.7
2.1
Minda Industries
Neutral
1,036
-
8,952
4,328
5,084
11.0
11.9
27.3
36.4
38.0
28.5
8.1
6.3
23.1
25.6
2.1
1.8
Motherson Sumi
Neutral
355
-
74,776
55,937
64,445
10.8
11.4
16.9
21.1
21.0
16.9
4.7
4.8
25.2
25.4
1.4
1.2
Tata Motors
Neutral
415
-
119,695
303,167
343,649
11.8
13.8
33.1
54.7
12.5
7.6
2.1
1.6
16.9
23.0
0.4
0.4
TVS Motor
Neutral
701
-
33,304
13,992
16,216
9.0
9.4
17.1
20.3
41.1
34.5
10.9
8.4
29.7
27.7
2.3
1.9
Amara Raja Batteries
Accumulate
796
858
13,597
6,140
7,122
14.3
15.6
29.3
39.0
27.2
20.4
4.6
3.9
17.1
19.0
2.2
1.9
Exide Industries
Neutral
200
-
16,979
8,689
9,854
15.1
15.2
9.7
11.0
20.7
18.2
3.7
3.2
15.7
16.1
1.7
1.5
Apollo Tyres
Neutral
231
-
13,240
15,739
17,326
13.3
14.6
20.4
26.7
11.4
8.7
1.4
1.2
20.4
26.7
1.1
1.0
Ceat
Neutral
1,716
-
6,942
6,661
7,717
11.1
14.2
116.2
178.2
14.8
9.6
2.6
2.1
15.2
21.3
1.2
1.0
JK Tyres
Neutral
148
-
3,352
8,318
9,239
16.2
16.4
21.0
27.5
7.1
5.4
1.4
1.1
19.1
20.4
0.9
0.7
Swaraj Engines
Neutral
1,889
-
2,346
788
889
16.4
16.5
71.6
81.0
26.4
23.3
7.6
7.1
29.6
31.0
2.6
2.3
Subros
Neutral
247
-
1,479
1,855
2,135
11.6
11.8
10.3
14.7
24.1
16.8
3.7
3.1
15.8
19.1
1.0
0.9
Capital Goods
BEML
Neutral
1,663
-
6,923
4,286
5,194
7.1
8.2
42.9
58.1
38.8
28.6
3.2
2.9
7.6
8.7
1.7
1.4
Bharat Electronics
Neutral
176
-
43,145
10,258
12,470
19.6
19.5
7.3
8.6
24.1
20.4
0.5
0.4
20.4
21.9
3.7
3.0
Voltas
Neutral
600
-
19,865
6,778
8,004
9.6
11.0
17.1
22.4
35.1
26.8
8.4
7.3
17.7
19.8
2.6
2.2
BHEL
Neutral
91
-
33,410
33,200
39,167
6.8
9.5
6.2
11.2
14.7
8.1
0.7
0.7
4.6
8.0
0.6
0.4
Blue Star
Buy
702
867
6,729
5,220
6,207
6.3
6.6
16.8
22.3
41.8
31.5
8.3
7.3
19.9
23.3
1.3
1.0
CG Power and Industrial
Neutral
82
-
5,133
6,555
7,292
7.5
7.5
-
0.8
8,190.0
102.4
1.3
1.3
0.1
1.2
0.9
0.8
Solutions
Greaves Cotton
Neutral
122
-
2,984
1,778
1,993
14.7
15.1
8.1
9.1
15.1
13.4
3.4
3.2
21.8
23.6
1.4
1.3
Stock Watch
November 15, 2017
Company Name
Reco
CMP
Target
Mkt Cap
Sales ( Čcr )
OPM(%)
EPS (Č)
PER(x)
P/BV(x)
RoE(%)
EV/Sales(x)
(Č)
Price ( Č)
( Č cr )
FY18E FY19E
FY18E
FY19E
FY18E
FY19E
FY18E
FY19E
FY18E
FY19E
FY18E
FY19E
FY18E
FY19E
Capital Goods
KEC International
Buy
299
350
7,697
9,779
11,113
9.4
9.8
14.2
18.2
21.1
16.5
4.0
3.3
21.1
22.1
1.0
0.9
KEI Industries
Accumulate
332
380
2,599
3,001
3,391
10.0
10.0
13.0
16.1
25.5
20.6
4.6
3.8
18.2
18.7
1.0
0.9
Thermax
Neutral
1,000
-
11,917
4,125
4,747
10.3
10.8
26.7
31.5
37.5
31.8
4.2
3.8
11.2
12.0
2.6
2.3
VATech Wabag
Buy
555
681
3,032
3,867
4,126
9.6
10.0
34.9
39.8
15.9
14.0
2.6
2.3
17.7
17.5
0.8
0.7
Cement
ACC
Neutral
1,749
-
32,845
12,255
13,350
13.5
14.3
58.0
66.2
30.2
26.4
3.6
3.3
11.5
12.2
2.7
2.4
Ambuja Cements
Neutral
271
-
53,890
10,250
11,450
17.5
19.0
7.2
8.3
37.7
32.7
2.7
2.6
7.0
7.8
5.0
4.4
India Cements
Neutral
166
-
5,111
6,135
6,750
14.8
15.2
8.5
11.5
19.5
14.4
1.0
0.9
4.8
6.2
1.2
1.0
JK Cement
Neutral
1,077
-
7,529
4,150
4,775
19.2
20.0
49.0
63.5
22.0
17.0
3.5
3.0
17.0
18.5
2.3
1.9
J K Lakshmi Cement
Neutral
438
-
5,158
3,422
3,757
15.5
17.0
13.5
23.2
32.5
18.9
3.4
2.9
10.8
15.5
1.9
1.7
Orient Cement
Neutral
161
-
3,296
2,215
3,233
16.8
17.0
5.9
6.9
27.3
23.3
2.1
1.9
10.8
10.1
2.5
1.7
UltraTech Cement
Neutral
4,357
-
119,619
28,250
35,150
20.2
23.5
77.5
122.2
56.2
35.7
4.7
4.3
9.6
14.8
4.7
3.8
Construction
KNR Constructions
Neutral
264
-
3,711
1,846
2,203
14.5
14.5
12.1
13.7
21.8
19.3
1.2
1.0
17.5
16.7
2.1
1.7
Larsen & Toubro
Neutral
1,210
-
169,445
95,787
109,476
10.2
11.6
44.5
50.8
27.2
23.8
3.4
3.1
12.9
13.1
2.3
2.1
Gujarat Pipavav Port
Neutral
135
-
6,507
739
842
61.6
62.7
5.1
6.2
26.4
21.9
3.3
3.2
12.7
14.9
8.3
7.1
PNC Infratech
Neutral
176
-
4,523
2,040
2,935
13.0
13.0
6.4
9.0
27.6
19.6
0.7
0.6
9.7
12.2
2.2
1.6
Simplex Infra
Neutral
514
-
2,542
6,012
6,619
11.6
11.7
21.1
31.0
24.4
16.6
1.7
1.6
6.5
8.6
1.0
0.9
Sadbhav Engineering
Neutral
316
-
5,425
3,823
4,426
10.7
10.8
10.3
11.8
30.7
26.8
3.7
3.2
10.1
10.5
1.7
1.5
NBCC
Neutral
270
-
24,323
9,099
12,706
6.4
6.4
7.3
9.6
37.1
28.3
1.6
1.3
27.5
30.5
2.5
1.8
MEP Infra
Neutral
103
-
1,670
2,403
2,910
18.3
16.8
2.4
6.1
43.7
16.9
16.6
11.2
35.2
55.8
1.9
1.5
SIPL
Neutral
123
-
4,322
2,060
2,390
46.8
47.7
(5.8)
(3.1)
4.6
5.2
(14.2)
(2.3)
6.9
6.4
Engineers India
Neutral
183
-
12,362
1,795
2,611
21.1
22.4
5.9
8.1
31.1
22.7
2.2
2.2
12.9
16.1
5.3
3.5
Financials
Axis Bank
Accumulate
546
580
130,994
32,558
35,843
3.5
3.2
27.8
41.0
19.6
13.3
2.1
1.9
11.4
14.9
-
-
Bank of Baroda
Neutral
174
-
40,185
22,533
26,079
2.4
2.4
12.0
20.9
14.5
8.4
0.9
0.9
6.6
11.0
-
-
Canara Bank
Neutral
377
-
22,518
17,925
20,235
2.0
2.1
18.5
36.5
20.4
10.3
0.8
0.7
3.4
6.2
-
-
Can Fin Homes
Neutral
454
-
6,037
586
741
3.5
3.5
107.8
141.0
4.2
3.2
0.9
0.8
24.1
25.6
-
-
Cholamandalam Inv. &
Neutral
1,251
-
19,546
2,826
3,307
6.3
6.3
53.7
64.6
23.3
19.4
4.0
3.4
18.3
18.9
-
-
Fin. Co.
Dewan Housing Finance Accumulate
622
712
19,502
2,676
3,383
2.4
2.7
37.4
49.7
16.6
12.5
2.2
1.9
13.8
16.2
-
-
Equitas Holdings
Buy
141
235
4,775
1,125
1,380
9.6
9.8
1.5
6.0
93.8
23.4
2.1
2.0
2.4
8.2
-
-
Federal Bank
Accumulate
111
125
21,751
4,896
5,930
2.8
3.1
5.4
7.6
20.7
14.7
1.8
1.6
8.5
11.0
-
-
Stock Watch
November 15, 2017
Company Name
Reco
CMP
Target
Mkt Cap
Sales ( Čcr )
OPM(%)
EPS (Č)
PER(x)
P/BV(x)
RoE(%)
EV/Sales(x)
(Č)
Price ( Č)
( Č cr )
FY18E FY19E
FY18E
FY19E
FY18E
FY19E
FY18E
FY19E
FY18E
FY19E
FY18E
FY19E
FY18E
FY19E
Financials
GIC Housing
Buy
432
655
2,326
376
477
3.6
3.7
33.0
40.0
13.1
10.8
2.4
2.0
20.0
23.0
-
-
HDFC Bank
Neutral
1,802
-
466,007
55,236
63,253
4.5
4.4
68.9
82.4
26.2
21.9
4.6
3.8
18.7
18.5
-
-
ICICI Bank
Neutral
314
-
201,440
42,361
51,378
3.6
3.9
18.4
25.7
17.1
12.2
1.9
1.8
11.3
15.0
-
-
Karur Vysya Bank
Buy
125
180
7,536
3,289
3,630
3.7
3.9
10.8
14.1
11.5
8.9
1.4
1.2
12.5
14.7
-
-
LIC Housing Finance
Accumulate
585
630
29,525
4,895
6,332
3.4
3.7
50.7
66.8
11.5
8.8
2.3
1.9
21.7
23.8
-
-
Punjab Natl.Bank
Neutral
184
-
39,187
23,708
25,758
2.1
2.1
5.9
16.4
31.3
11.2
0.9
0.9
3.0
8.3
-
-
RBL Bank
Neutral
510
-
21,231
2,309
2,888
2.6
2.5
16.4
19.1
31.2
26.8
3.9
3.5
13.3
13.8
-
-
Repco Home Finance
Buy
631
825
3,947
496
597
4.4
4.2
38.5
48.7
16.4
13.0
2.9
2.4
19.6
20.6
-
-
South Ind.Bank
Neutral
30
-
5,494
3,195
3,567
3.0
3.1
3.0
3.8
10.1
8.0
1.0
0.9
10.5
11.9
-
-
St Bk of India
Neutral
329
-
284,167
105,827
121,056
2.4
2.5
16.1
25.6
20.5
12.9
1.6
1.5
6.6
9.9
-
-
Union Bank
Neutral
164
-
11,928
14,650
16,225
2.3
2.3
23.1
32.5
7.1
5.1
0.5
0.5
7.1
9.2
-
-
Yes Bank
Neutral
302
-
69,282
11,088
13,138
3.0
2.9
84.0
99.3
3.6
3.0
0.6
0.5
16.3
16.8
-
-
FMCG
Akzo Nobel India
Neutral
1,782
-
8,549
3,164
3,607
13.8
13.7
58.6
67.9
30.4
26.2
7.5
6.6
24.5
25.1
2.6
2.2
Asian Paints
Neutral
1,154
-
110,715
17,603
20,615
18.6
18.6
2,128.9
2,543.3
0.5
0.5
11.4
9.6
28.0
28.9
6.1
5.1
Britannia
Neutral
4,786
-
57,455
9,690
11,278
14.8
15.4
84.0
101.0
57.0
47.4
20.8
16.5
40.6
39.0
5.9
5.1
Colgate
Neutral
1,055
-
28,693
4,420
5,074
24.9
25.3
28.6
32.8
36.9
32.2
14.6
11.8
43.8
40.5
6.2
5.4
Dabur India
Neutral
337
-
59,381
8,346
9,344
19.6
19.9
7.8
9.0
43.2
37.5
8.7
7.9
25.2
24.8
6.7
5.9
GlaxoSmith Con*
Neutral
6,015
-
25,295
5,072
5,760
18.2
18.4
176.3
199.2
34.1
30.2
7.2
6.6
21.2
21.7
4.3
3.7
Godrej Consumer
Neutral
931
-
63,405
10,171
11,682
20.8
21.5
21.7
27.1
42.9
34.3
9.6
8.3
22.3
23.4
6.4
5.5
HUL
Neutral
1,283
-
277,800
37,077
41,508
20.3
21.8
5,189.9
6,318.5
0.3
0.2
39.1
33.4
74.8
82.0
7.3
6.6
ITC
Neutral
257
-
312,619
44,588
49,853
37.0
37.3
9.6
11.0
26.7
23.3
6.6
6.2
25.1
27.3
6.5
5.8
Marico
Neutral
298
-
38,523
6,788
7,766
18.5
19.2
7.1
8.5
42.0
35.1
14.7
12.6
36.9
38.0
5.5
4.8
Nestle*
Neutral
7,648
-
73,743
10,083
11,182
20.0
20.9
119.7
141.3
63.9
54.1
225.2
205.8
36.7
39.8
7.0
6.3
Tata Global
Neutral
247
-
15,570
7,121
7,641
11.9
12.3
6.9
8.0
35.8
30.8
2.4
2.3
6.8
7.2
2.0
1.8
Procter & Gamble
Neutral
8,831
-
28,667
3,034
3,579
27.1
27.7
167.7
198.8
52.7
44.4
14.1
12.2
28.8
29.5
8.9
7.4
Hygiene
IT
HCL Tech^
Buy
869
1,014
124,034
50,009
54,608
22.1
22.1
62.8
67.6
13.8
12.9
3.1
2.7
22.4
20.6
2.1
1.8
Infosys
Buy
949
1,120
218,088
70,333
75,960
26.0
26.0
61.7
65.9
15.4
14.4
2.9
2.7
18.9
18.7
2.5
2.2
TCS
Neutral
2,717
-
520,064
123,384
134,488
26.1
26.1
133.2
143.7
20.4
18.9
5.6
5.2
27.6
27.8
3.9
3.5
Tech Mahindra
Accumulate
489
533
47,731
31,015
33,496
15.0
15.0
35.6
38.1
13.7
12.8
2.3
2.2
17.0
16.3
1.3
1.1
Stock Watch
November 15, 2017
Company Name
Reco
CMP
Target
Mkt Cap
Sales ( Čcr )
OPM(%)
EPS (Č)
PER(x)
P/BV(x)
RoE(%)
EV/Sales(x)
(Č)
Price ( Č)
( Č cr )
FY18E FY19E
FY18E
FY19E
FY18E
FY19E
FY18E
FY19E
FY18E
FY19E
FY18E
FY19E
FY18E
FY19E
IT
Wipro
Neutral
299
-
145,538
54,164
56,544
22.3
22.3
18.8
19.5
15.9
15.3
2.5
2.2
15.0
13.6
1.9
1.7
Media
D B Corp
Neutral
365
-
6,707
2,404
2,625
30.5
31.5
23.7
26.9
15.4
13.6
3.6
3.1
23.5
22.8
2.6
2.4
HT Media
Neutral
98
-
2,290
2,589
2,830
15.1
15.4
8.3
10.9
11.9
9.0
1.0
0.9
8.4
10.4
0.4
0.3
Jagran Prakashan
Buy
166
225
5,437
2,541
2,835
28.5
28.7
12.7
14.1
13.1
11.8
2.7
2.4
21.3
21.4
2.0
1.7
Sun TV Network
Neutral
852
-
33,580
3,238
3,789
51.9
55.1
30.9
38.0
27.6
22.4
7.9
6.9
30.0
31.0
9.9
8.3
Hindustan Media
Neutral
245
-
1,797
1,002
1,074
23.3
23.5
29.2
33.8
8.4
7.2
1.3
1.1
15.6
15.4
0.8
0.5
Ventures
TV Today Network
Buy
365
435
2,180
667
727
27.7
27.7
18.6
20.1
19.7
18.2
3.1
3.1
15.6
17.3
2.8
2.6
Music Broadcast Limited Buy
377
434
2,151
271
317
91.0
109.0
6.0
10.0
62.8
37.7
3.9
3.6
6.5
9.3
7.5
6.2
Metals & Mining
Coal India
Neutral
275
-
170,393
82,301
91,235
17.0
18.0
17.1
20.5
16.1
13.4
3.0
2.8
45.0
55.0
1.7
1.6
Hind. Zinc
Neutral
310
-
130,922
22,108
24,555
57.0
58.0
22.1
26.3
14.0
11.8
4.5
3.7
32.0
35.0
4.9
4.1
Hindalco
Neutral
261
-
58,554
102,350
105,355
13.5
14.5
21.5
24.5
12.1
10.7
1.7
1.4
15.0
15.2
1.1
1.1
JSW Steel
Neutral
266
-
64,322
64,500
68,245
21.1
21.5
20.1
21.2
13.2
12.6
2.4
2.1
-
-
1.7
1.7
NMDC
Neutral
125
-
39,644
10,209
11,450
47.0
48.0
11.1
12.1
11.3
10.4
1.6
1.5
-
-
3.4
3.1
SAIL
Neutral
80
-
32,958
54,100
63,555
3.0
10.0
(10.0)
1.5
53.2
1.1
1.1
-
-
1.6
1.4
Vedanta
Neutral
309
-
114,843
81,206
87,345
28.0
29.0
26.5
33.5
11.7
9.2
2.7
2.3
-
-
2.2
1.9
Tata Steel
Neutral
685
-
66,548
121,445
126,500
16.2
17.2
65.4
81.3
10.5
8.4
1.7
1.4
-
-
1.1
0.9
Oil & Gas
GAIL
Neutral
456
-
77,200
53,115
52,344
14.2
15.3
30.0
31.1
15.2
14.7
1.9
1.8
-
-
1.2
1.2
ONGC
Neutral
182
-
233,565
83,111
84,934
44.2
44.9
16.4
16.9
11.1
10.8
1.3
1.3
-
-
2.7
2.7
Indian Oil Corp
Neutral
387
-
187,899
396,116
432,560
8.5
8.8
40.1
42.2
9.7
9.2
1.7
1.5
-
-
0.6
0.6
Reliance Industries
Neutral
886
-
576,367
257,711
267,438
17.0
18.2
89.1
89.5
10.0
9.9
0.9
0.9
-
-
1.9
1.8
Pharmaceuticals
Alembic Pharma
Buy
515
600
9,706
3,903
4,584
18.2
19.2
21.8
27.2
23.6
18.9
4.3
3.6
19.8
20.6
2.5
2.1
Alkem Laboratories Ltd
Accumulate
1,996
2,125
23,864
6,320
7,341
17.5
19.8
72.7
96.6
27.5
20.7
4.9
4.1
16.7
18.7
3.7
3.1
Aurobindo Pharma
Buy
701
823
41,047
17,086
19,478
22.1
22.0
44.7
51.4
15.7
13.6
3.5
2.8
24.7
22.7
2.5
2.2
Aventis*
Neutral
4,441
-
10,228
2,508
2,862
16.8
16.8
139.9
153.8
31.8
28.9
4.6
3.7
23.5
25.8
3.7
3.1
Cadila Healthcare
Reduce
449
426
45,915
11,584
13,228
20.3
20.4
18.7
21.3
24.0
21.1
5.4
4.4
24.6
22.9
3.8
3.3
Cipla
Sell
602
458
48,451
16,619
19,437
15.4
16.2
19.7
24.3
30.6
24.8
3.5
3.1
12.0
13.2
3.1
2.6
Dr Reddy's
Neutral
2,321
-
38,486
15,844
17,973
17.6
18.2
91.7
111.0
25.3
20.9
2.9
2.6
11.9
13.0
2.6
2.3
GSK Pharma*
Neutral
2,595
-
21,981
3,260
3,651
15.0
18.0
46.1
58.6
56.3
44.3
11.6
11.9
20.0
26.5
6.6
6.0
Indoco Remedies
Sell
279
153
2,574
1,154
1,310
14.9
14.9
11.3
12.7
24.7
22.0
3.5
3.1
15.0
15.0
2.4
2.0
Stock Watch
November 15, 2017
Company Name
Reco
CMP
Target
Mkt Cap
Sales ( Čcr )
OPM(%)
EPS (Č)
PER(x)
P/BV(x)
RoE(%)
EV/Sales(x)
(Č)
Price ( Č)
( Č cr )
FY18E FY19E
FY18E
FY19E
FY18E
FY19E
FY18E
FY19E
FY18E
FY19E
FY18E
FY19E
FY18E
FY19E
Pharmaceuticals
Ipca labs
Neutral
536
-
6,762
3,593
4,022
14.5
15.5
19.4
25.2
27.6
21.3
2.5
2.3
9.5
11.2
1.9
1.7
Lupin
Buy
835
1,467
37,739
18,657
21,289
21.3
23.3
52.8
66.7
15.8
12.5
2.4
2.0
16.3
17.5
2.0
1.7
Natco Pharma
Accumulate
928
1,057
16,189
1,886
2,016
32.3
29.5
23.2
22.0
40.1
42.1
8.4
7.4
20.9
17.6
8.4
7.9
Sun Pharma
Accumulate
526
558
126,236
32,899
36,451
26.9
25.4
31.6
32.3
16.7
16.3
2.9
2.6
18.7
18.8
3.5
3.0
Syngene International
Accumulate
503
556
10,051
1,394
1,818
33.0
36.0
15.8
20.6
31.8
24.4
5.9
4.9
18.6
20.0
7.2
5.5
Power
Tata Power
Neutral
82
-
22,125
32,547
33,806
20.5
20.5
4.7
5.4
17.4
15.3
1.7
1.4
10.5
10.5
1.7
1.6
NTPC
Neutral
177
-
145,903
86,070
101,246
28.3
30.7
12.9
16.2
13.7
10.9
1.4
1.3
10.6
12.4
3.1
2.7
Power Grid
Accumulate
207
223
108,163
29,183
32,946
89.7
90.0
18.0
20.8
11.5
9.9
1.9
1.7
17.7
18.2
7.6
7.1
Real Estate
Prestige Estate
Neutral
293
-
11,004
4,607
5,146
21.0
22.2
7.9
9.8
37.2
29.9
2.3
2.1
10.3
12.0
3.6
3.2
MLIFE
Buy
429
522
2,202
487
590
12.3
17.8
21.0
31.2
20.4
13.8
1.1
1.0
5.2
7.4
3.2
2.6
Telecom
Bharti Airtel
Neutral
498
-
199,091
97,903
105,233
36.0
36.3
9.3
11.1
53.6
45.1
2.6
2.4
5.0
5.6
3.0
2.7
Idea Cellular
Neutral
92
-
33,349
35,012
37,689
27.1
27.7
(4.4)
(2.7)
1.4
1.5
(6.8)
(4.6)
2.3
2.0
zOthers
Abbott India
Neutral
4,973
-
10,568
3,244
3,723
14.9
16.1
167.5
209.4
29.7
23.8
6.6
5.5
23.7
24.8
2.9
2.5
Asian Granito
Buy
491
570
1,478
1,169
1,286
12.5
12.5
16.0
19.7
30.8
24.9
3.3
2.9
10.7
11.6
1.5
1.3
Bajaj Electricals
Neutral
412
-
4,194
4,646
5,301
6.7
7.6
16.1
22.3
25.6
18.5
4.2
3.6
16.4
19.2
0.9
0.8
Banco Products (India)
Neutral
217
-
1,549
1,530
1,695
13.2
12.7
19.0
20.0
11.4
10.8
1.8
1.6
0.2
0.2
0.9
102.5
Coffee Day Enterprises
Neutral
224
-
4,606
3,494
3,913
17.4
18.0
4.8
5.7
-
39.2
2.0
1.9
-
0.1
1.8
1.6
Ltd
Elecon Engineering
Neutral
70
-
783
171
201
15.0
16.2
36.0
43.0
1.9
1.6
0.2
0.2
0.1
0.1
4.0
3.4
Garware Wall Ropes
Neutral
902
-
1,973
928
1,003
15.2
15.2
39.4
43.2
22.9
20.9
3.8
3.2
16.5
15.4
2.0
1.8
Goodyear India*
Neutral
798
-
1,841
1,717
1,866
11.8
12.3
47.9
49.8
16.7
16.0
2.6
2.2
15.6
15.7
0.8
109.8
Hitachi
Neutral
2,450
-
6,661
2,355
2,715
10.3
10.8
49.0
60.9
50.0
40.2
11.7
9.3
0.2
0.2
2.9
2.5
HSIL
Neutral
459
-
3,316
2,240
2,670
14.6
15.0
17.0
22.0
27.0
20.9
2.2
2.1
0.1
0.1
1.7
1.4
Interglobe Aviation
Neutral
1,168
-
44,844
22,570
27,955
14.2
15.0
63.6
81.8
18.4
14.3
9.7
8.2
0.5
0.6
1.7
1.3
Jyothy Laboratories
Neutral
337
-
6,130
1,781
2,044
14.1
15.0
9.4
10.5
36.1
32.1
7.7
7.2
0.2
0.2
3.7
3.1
Linc Pen & Plastics
Neutral
240
-
355
420
462
9.3
9.3
15.3
17.1
15.7
14.0
2.7
2.7
16.9
19.5
0.9
0.8
M M Forgings
Neutral
864
-
1,042
542
642
20.1
21.0
41.6
56.8
20.8
15.2
2.9
2.4
0.1
0.2
2.3
2.0
Mirza International
Neutral
158
-
1,901
1,148
1,285
18.0
18.0
8.0
9.4
19.7
16.9
3.3
2.8
16.3
16.1
1.8
1.6
Navkar Corporation
Buy
188
265
2,834
561
617
41.5
41.5
11.5
12.7
16.4
14.8
1.7
1.5
10.5
10.4
5.7
5.0
Nilkamal
Neutral
1,586
-
2,366
2,317
2,525
11.4
11.1
96.0
105.0
16.5
15.1
2.8
2.4
0.2
0.2
1.0
0.9
Stock Watch
November 15, 2017
Company Name
Reco
CMP
Target Mkt Cap
Sales ( Čcr )
OPM(%)
EPS (Č)
PER(x)
P/BV(x)
RoE(%)
EV/Sales(x)
(Č)
Price ( Č)
( Č cr )
FY18E FY19E FY18E FY19E FY18E FY19E FY18E FY19E FY18E FY19E FY18E FY19E FY18E FY19E
zOthers
Parag Milk Foods
Neutral
241
-
2,031
1,987
2,379
7.6
9.0
12.4
18.3
19.5
13.2
2.7
2.4
8.2
13.2
1.1
1.0
Radico Khaitan
Neutral
217
-
2,891
1,811
1,992
13.2
13.2
8.1
8.8
26.8
24.7
2.7
3.0
10.1
12.0
1.9
1.7
Relaxo Footwears
Neutral
564
-
6,777
1,981
2,310
13.7
14.5
12.0
15.5
47.0
36.4
9.2
7.4
0.2
0.2
3.5
3.0
Siyaram Silk Mills
Accumulate
580
650
2,719
1,769
1,981
12.7
12.7
22.6
26.2
25.6
22.1
4.0
3.4
15.5
15.5
1.7
1.5
Styrolution ABS India* Neutral
945
-
1,663
1,800
1,980
8.0
8.1
42.0
46.2
22.5
20.5
2.5
2.2
0.1
0.1
1.0
1.0
Surya Roshni
Neutral
353
-
1,549
4,870
5,320
7.7
7.8
22.8
28.1
15.5
12.6
2.1
1.8
0.1
0.1
0.5
0.5
TVS Srichakra
Neutral
3,159
-
2,419
2,729
2,893
12.7
12.5
248.5
265.0
12.7
11.9
3.6
2.9
0.3
0.3
0.9
0.8
Visaka Industries
Neutral
662
-
1,051
1,104
1,214
12.1
12.6
31.0
37.9
21.4
17.5
2.6
2.3
0.1
0.1
1.2
1.1
VIP Industries
Neutral
316
-
4,461
1,450
1,693
10.4
10.5
6.5
7.8
48.2
40.4
10.2
8.9
21.1
22.1
3.1
2.6
Navin Fluorine
Accumulate
689
730
3,398
945
1,154
22.4
22.6
28.7
34.8
24.0
19.8
4.0
3.4
-
-
3.1
2.4
Source: Company, Angel Research; Note: *December year end; #September year end; &October year end; Price as on November 14, 2017
Market Outlook
November 15, 2017
Research Team Tel: 022 - 39357800
DISCLAIMER
Angel Broking Private Limited (hereinafter referred to as “Angel”) is a registered Member of National Stock Exchange of India
Limited,Bombay Stock Exchange Limited and Metropolitan Stock Exchange Limited. It is also registered as a Depository Participant with
CDSL and Portfolio Manager with SEBI. It also has registration with AMFI as a Mutual Fund Distributor. Angel Broking Private Limited is a
registered entity with SEBI for Research Analyst in terms of SEBI (Research Analyst) Regulations, 2014 vide registration number
INH000000164. Angel or its associates has not been debarred/ suspended by SEBI or any other regulatory authority for accessing
/dealing in securities Market. Angel or its associates/analyst has not received any compensation / managed or
co-managed public offering of securities of the company covered by Analyst during the past twelve months.
This document is solely for the personal information of the recipient, and must not be singularly used as the basis of any investment
decision. Nothing in this document should be construed as investment or financial advice. Each recipient of this document should make
such investigations as they deem necessary to arrive at an independent evaluation of an investment in the securities of the companies
referred to in this document (including the merits and risks involved), and should consult their own advisors to determine the merits and
risks of such an investment.
Reports based on technical and derivative analysis center on studying charts of a stock's price movement, outstanding positions and
trading volume, as opposed to focusing on a company's fundamentals and, as such, may not match with a report on a company's
fundamentals. Investors are advised to refer the Fundamental and Technical Research Reports available on our website to evaluate the
contrary view, if any.
The information in this document has been printed on the basis of publicly available information, internal data and other reliable
sources believed to be true, but we do not represent that it is accurate or complete and it should not be relied on as such, as this
document is for general guidance only. Angel Broking Pvt. Limited or any of its affiliates/ group companies shall not be in any way
responsible for any loss or damage that may arise to any person from any inadvertent error in the information contained in this report.
Angel Broking Pvt. Limited has not independently verified all the information contained within this document. Accordingly, we cannot
testify, nor make any representation or warranty, express or implied, to the accuracy, contents or data contained within this document.
While Angel Broking Pvt. Limited endeavors to update on a reasonable basis the information discussed in this material, there may be
regulatory, compliance, or other reasons that prevent us from doing so.
This document is being supplied to you solely for your information, and its contents, information or data may not be reproduced,
redistributed or passed on, directly or indirectly.
Neither Angel Broking Pvt. Limited, nor its directors, employees or affiliates shall be liable for any loss or damage that may arise from
or in connection with the use of this information.